
Weekly Mortgage Rate Watch July 15th – 19th
- Marcus
- Jul 26, 2024
- 10 min read

The First Half of 2024 in Review
Though mortgage rates fluctuate on a day-to-day or week-to-week basis following the bond market’s direction, which is influenced by a variety of factors, including economic data, geopolitical events, and, of course, commentary or changes in monetary policy by the Federal Reserve, if we look at the latest three-month period, mortgage rates have been on a declining trend, with rates decreasing each of the last eight days. This is a welcome sign for homebuyers after a disappointing first quarter of 2024, during which consumers experienced a significant rise in interest rates from 6.76% in January all the way up to 7.50% in April. This shift was due to disappointing inflationary and labor market data that depicted stalled progress on inflation and stubborn wage growth.
The second quarter of 2024 tells a different story. Inflation indicators, such as the Consumer Price Index (CPI) and the Personal Consumption Expenditures (PCE) index, show a decline in inflation. Additionally, labor statistics reveal that the labor market is coming into better balance. Jerome Powell, chairman of the Federal Reserve, recently commented that the labor market has normalized to pre-pandemic levels. This has markets optimistic that the central bank will begin to lower interest rates in September. This shift in the narrative around the future of interest rates has driven the recent three-month decline in mortgage rates, from 7.52% in April to 6.82% last Friday. Where will rates go in the 3rd quarter of 2024 and beyond? You will just have to keep your eyes on the economic reports, stay tuned to commentary by the Federal Reserve, and keep reading the weekly releases of the Mortgage News Daily articles.
Monday: Manufacturing Sector Faces Rising Costs and Weakening Employment
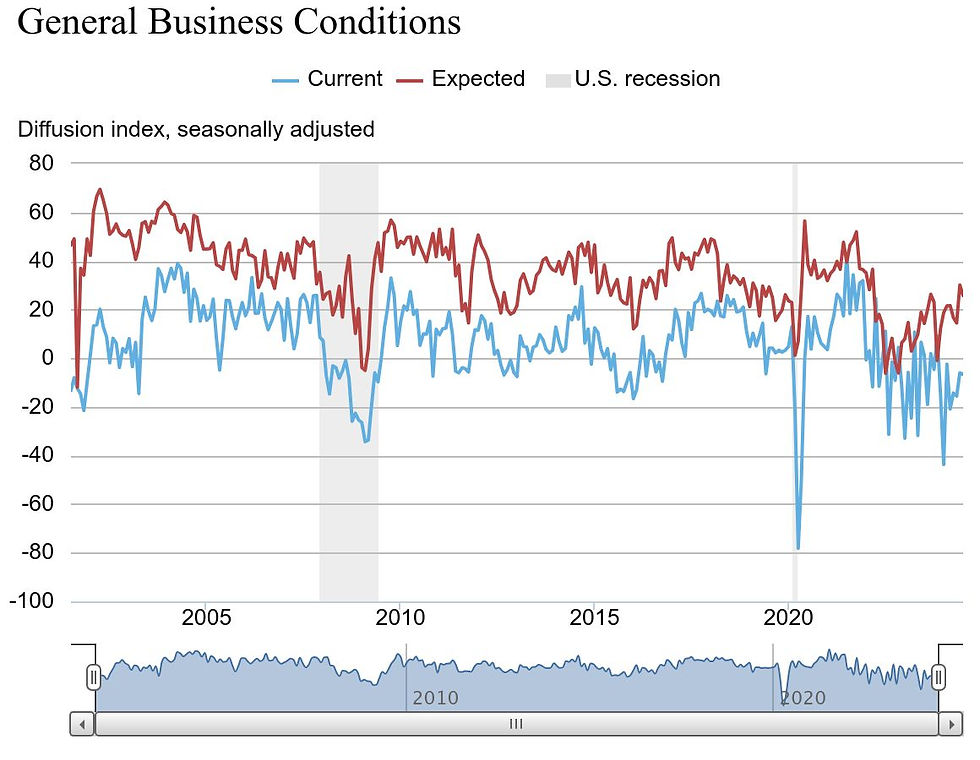
Mondays are always relatively quiet when it comes to economic data, but this Monday included the release of the Empire State Manufacturing Survey, which measures the health of the manufacturing sector in New York. Though this survey report covers only the state of New York, it includes input from 200 manufacturing executives. New York also has a very diverse manufacturing sector, including high-tech machinery and fabricated metals. Additionally, New York's manufacturing sector is interconnected with the broader national manufacturing sector and is highly correlated with broader national manufacturing trends. This includes forward-looking indicators such as prices paid, which reflect the cost of inputs for manufacturing companies, and prices received, which reflect pass-through prices to consumers. These indicators can provide insights into inflationary forces.
A positive index value indicates that more respondents reported improvements than declines, suggesting expansion in the manufacturing sector. Conversely, a negative index value indicates that more respondents reported deteriorations, suggesting contraction. For instance, an index reading of -6.6 means that 6.6% more respondents reported worsening conditions than those reporting improvements. A rating of 0 means the respondents were split, with half reporting declines and half reporting improvements.
Data from the Empire State Manufacturing Survey ( June).
· General business activity continued to decline, with the index dropping by- 0.6 to -6.6.
· New orders remained relatively steady, improving by +0.4 to -6.
· Employment contracted, improving by +0.8 but overall remaining negative at -7.9.
· Prices paid increased by +2.0 to +26.5,
· Prices received showed a decline of -1.0 to +6.1 overall.
The data reflects a business environment where the manufacturing sector is experiencing increases in input costs due to rising commodity prices and labor costs and is struggling to pass through the increased cost of production to consumers, especially low- and middle-income consumers who are feeling financially stretched. This creates a very challenging business environment where businesses are likely experiencing pressure on their profit margins. To rebalance, many businesses may be forced to cut costs, which could include layoffs or slowed hiring, which is already reflected in the survey respondents reporting worsening employment conditions and the decline in capital spending predictions.
On the bright side, optimism remained anchored regarding the future of New York's manufacturing sector. Expectations for general business conditions over the next six months remained in positive territory overall, though declining slightly on a monthly basis as 41% of respondents expect business conditions in the next 6 months to improve, while only 15% expect them to deteriorate.
The Empire State Manufacturing Survey is not a market-moving economic release, but it is still a piece of data that tells a story about the economy, and it is prudent to pay attention to it. The survey has consistently shown over the past year that the manufacturing sector has struggled as goods prices have remained flat or even deflated while consumers have turned their spending focus to services.
Mortgage rates declined slightly, with the average rate for a 30-year fixed-rate mortgage dropping by 0.1% from last Friday to 6.81%.
Tuesday: Mixed Signals from Consumer Data and Housing Market Challenges
Tuesday brought a focus on consumer behavior with the release of the retail sales report, which often has a significant influence over the bond market and interest rates due to its detailing of consumer spending, which makes up two-thirds of US GDP. While the retail sales report primarily covers consumer spending on goods and less so on services, it still provides crucial insights into consumers' spending habits and US economic health. The data in the report is adjusted for seasonal variations but not for inflation.

Retail sales report for June:
Total retail sales were virtually unchanged at $704.3 billion in June vs. $704.5 billion in May.
All major categories—including furniture, healthcare, food and beverage, and building materials—remained flat on a month-over-month basis.
Year-over-year retail sales were up 2.3%.
April-May percentage changes in retail sales were adjusted upward from 0.1% to 0.3%.
At face value, a 2.3% increase in retail sales on a year-over-year basis initially seems like growth. However, when factoring in inflation, with CPI and PCE headline numbers currently at 3% and 2.6%, respectively, inflation likely accounted for a significant portion of the rise in retail sales, indicating that consumers are not buying more; they are just paying more for the same or possibly fewer total purchases and having to make tough decisions when it comes to discretionary purchases, likely substituting cheaper alternative versions of their preferred products.
A slowdown in consumer spending is good news for interest rates, as softer demand means consumers will be less willing to pay increased prices, forcing manufacturers or service providers to keep prices steady or even lower prices to increase sales volumes.
Next up was the NAHB (National Association of Home Builders) survey, which continued to reflect struggling home builder sentiment due to the impact of higher rates, material costs, and land costs. All components—present sale conditions, expected sales, and buyer foot traffic—remained below the baseline of 50.
Present sales conditions fell one point to 47.
Expected sales in the next six months increased one point to 48.
The traffic of prospective buyers declined one point to 27.
The data also indicated further softening in the housing market as more builders were forced to reduce prices.
· 31% Of home builders were forced to do price reductions in July compared to 29% in June and 25% in May.
The home builder confidence survey doesn't give much indication about where inflation or rates are headed in the next three months, but it highlights growing issues of housing affordability in the longer term. If home builders remain pessimistic about their business environment, they are unlikely to accelerate production of the much-needed housing supply, which could lead to higher home prices due to supply constraints in the future.
The biggest news of the day came from Federal Reserve Chairman Jerome Powell, who spoke on Monday at the Economic Club in Washington, DC. During his interview, he mentioned that the Fed would not wait until inflation hits 2% before lowering rates due to the long and variable lags in monetary policy and the potential risk of degrading economic progress and the potential for inflation to fall below 2%. This statement was well-received by the bond market, especially when coupled with the recent positive economic data, giving the market further confidence that a rate cut in September is highly likely.
Rates jumped slightly but only by 0.3 basis points as the average rate on a 30-year fixed-rate mortgage ended the day at 6.84%.
Wednesday: Divergence in Housing Data Amid Modest Gains in Mortgage Applications
Midweek was relatively quiet in terms of data releases, with the primary focus on the housing sector, starting with new construction data. The report showed a tale of divergence: single-family construction struggled while multifamily new construction rebounded strongly after a year of stagnation.

New construction June Data:
Building permits were up 3.4% compared to May but down 3.1% year-over-year.
Multifamily permits for buildings with five units or more were up 19% compared to May.
Single-family permit issuance declined 2% on a month-over-month basis.
Housing starts rose by 3% compared to May but were down 4.4% year-over-year.
Multifamily (5+ units) starts increased by 22%.
Single-family starts experienced a 2.2% decline on a month-over-month basis.
Housing completions saw the biggest jump, increasing by 10% compared to May and 15% compared to June 2023.
Single-family completions did increase month-over-month but only by 1.8%.
Multifamily completions saw a parabolic rise of 26% on a month-over-month basis.
Though single-family home construction may be struggling at the moment, seeing a rebound in multifamily construction gives reason for optimism as it makes up a significant portion of the housing supply, particularly apartments and condo units. An increase in the production of housing is essential for moderating the cost of living in the US by putting the supply and demand dynamic in the housing market back in balance. This is only one month of data, though. we will need to see if this trend continues over the second half of the year. T
Following new construction data was news from the mortgage industry. The weekly release from the Mortgage Bankers Association showed an increase in mortgage applications driven by refinances.
Mortgage applications were up 3.9% compared to a week earlier.
Refinance applications increased by 15% compared to last week and were 37% higher year-over-year.
· Seasonally adjusted purchase applications were down 3% compared to last month,
It was not surprising to see a spike in refinance applications on a week-over-week basis due to the meaningful decline in rates over the past few weeks. What was interesting was the year-over-year explosion of a 37% increase in refinances, especially considering that rates are not much lower than they were a year ago (6.96% on July 12th, 2023 vs. 6.82% on July 12th, 2024).
The explanation lies in the fact that rates were on a consistent uptrend throughout 2023. Those who made recent purchases in 2022 had significantly lower rates, providing no incentive to refinance. However, with around 4-5 million homes purchased each year, many new homeowners who bought homes in 2023 have a mortgage rate of around 7.5%. Provided that rates have come down significantly since then, they now have an incentive to refinance as rates drop below 7%.
The decline in purchase applications was typical due to seasonality in the real estate market. Purchase volumes tend to decline through the end of the year, starting in June or July, as buyers aim to be settled before kids go back to school in August or September.
Mortgage rates dipped slightly for the day as the average rate on a 30-year fixed-rate mortgage sat at 6.83%, down slightly from the previous day's rate.
Thursday: Labor Market and Economic Indicators in Focus
With recent inflation reports suggesting moderation towards the Fed’s 2% goal, market attention has shifted more towards the labor market for signs of softening or deterioration. This brought Thursday’s initial jobless claims into sharp focus.
July is typically a volatile month for claims due to numerous temporary factory closures, and this July week was no exception.
Initial claims were up by 20,000 compared to the previous week, reaching 243,000.
This was 10,000 above market expectations of 233,000.
The four-week moving average for initial claims increased by 1,000 to 234,000.

Continued claims rose by 20,000 to 1.867 million, their highest level since November 2021.
The four-week moving average for continued claims also reached a high of 1.850 million, the highest since December 2021,
Up by 11,500 from the previous week.

Initial claims have stayed in a range over the past two years from around 194,000 to 243,000. While the recent softening in the labor market is noticeable, it is likely the result of slower hiring rather than a significant uptick in layoffs. Jerome Powell has mentioned on several occasions that the labor market is normalizing and returning to its pre-COVID state. This is positive news, but the Fed has yet to lower rates, and further deterioration in the labor market could impact spending, GDP, and the overall economy. Therefore, the market will continue to closely monitor future labor market data.
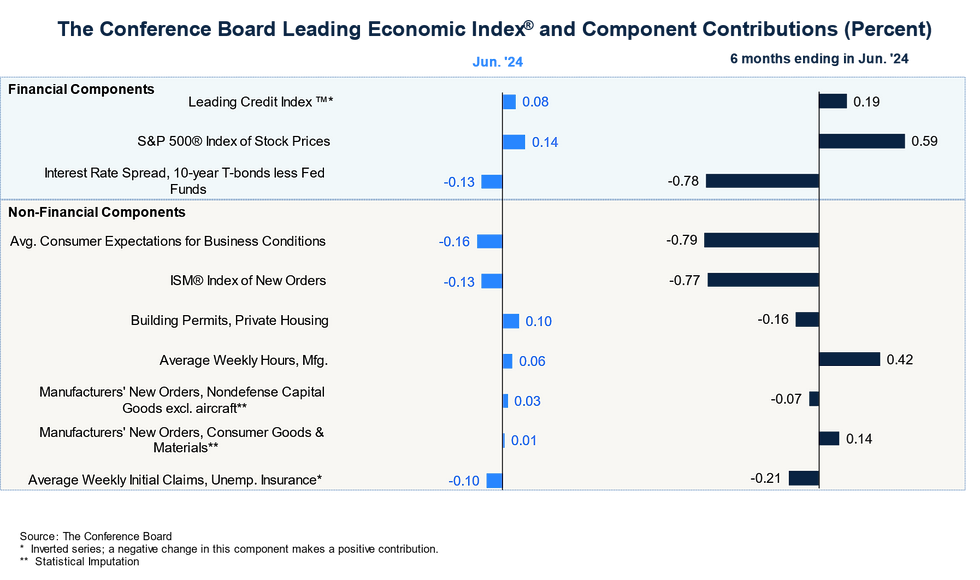
Also released on Thursday was the Leading Economic Index (LEI). Despite its name, the LEI is often considered a lagging indicator since most of its inputs—such as stock prices, employment, ISM manufacturing new orders, and new construction data—have already been released and priced into the bond market by the time this index is published. Additionally, the LEI primarily focuses on manufacturing productivity and does not cover much of the services sector, which constitutes over two-thirds of consumer spending.

The LEI for June showed continued contraction:
The Index declined by 0.2 points to 101.1, less than the 0.4-point decline in May.
The decline was fueled by weak new orders in manufacturing, deteriorating consumer confidence, an increase in jobless claims, and continued pressure from higher interest rates.
Over the first half of the year, the LEI has fallen by 1.9%, a smaller decline than the 2.9% contraction observed over the second half of last year.
Though still in negative territory, the index appears to have bottomed out and is moving back toward equilibrium.
While the LEI does not have a significant impact on the bond market, it consolidates recent economic data and is useful for anticipating future US GDP trends rather than predicting the direction of mortgage rates.
Mortgage rates dipped to their lowest level since February, with the average 30-year fixed mortgage rate settling at 6.81%. If we continue to see positive inflation data and the downward trend in interest rates sustains, it will likely lead to a jump in demand for home purchases as potential buyers, who are on the sidelines due to affordability constraints, opportunistically jump at the chance to get their own slice of real estate before the market or interest rates change once again.
The average rate for a 30-year fixed-rate mortgage ended the day at 6.81%, little changed from Wednesday as most of the data from the day came in line with expectations.
Friday: Unexpected Jump in Mortgage Rates Amid Corporate Bond Issuances
Friday saw no significant economic data or reports, yet mortgage rates jumped to 6.89%. This was notable given the lack of any major influencing factors. One key consideration is that in the absence of significant news or market activity, the bond market tends to be influenced more by traders repositioning and resizing their exposure, often selling off positions to capture recent gains from the previous few weeks.
The only notable occurrence on Friday was an unexpectedly large amount of corporate bond issuance, with companies selling more debt to investors than anticipated. Corporate bond issuance impacts the bond market and mortgage rates primarily through supply and demand dynamics. When corporations issue new bonds, the increased supply can lead to lower bond prices if demand doesn't keep pace, causing yields to rise. This rise in yields can influence mortgage rates, as lenders face higher borrowing costs and adjust rates accordingly.
Additionally, large-scale corporate bond issuance often signals economic optimism, suggesting expectations of higher future inflation and interest rates, which further contributes to increased mortgage rates. The combination of traders adjusting their positions and a surge in corporate bond issuance likely played a role in the unexpected rise in mortgage rates on an otherwise quiet day.


Comments